How the Economic Machine Works: A Simple Guide Based on Ray Dalio’s Framework
The economy often feels incredibly complex and unpredictable.
Ray Dalio, founder of the major investment firm Bridgewater Associates, developed a practical template for understanding the economy. He argues that it works like a relatively simple machine, driven by logical cause-and-effect relationships. This post breaks down his popular framework, primarily based on his paper “How the Economic Machine Works” and his widely watched animated video.
Disclaimer: This post explains Ray Dalio’s model. It’s a simplification for understanding and not financial advice. All concepts and original chart ideas belong to Ray Dalio and Bridgewater Associates, LP.
The Basic Building Block: Transactions
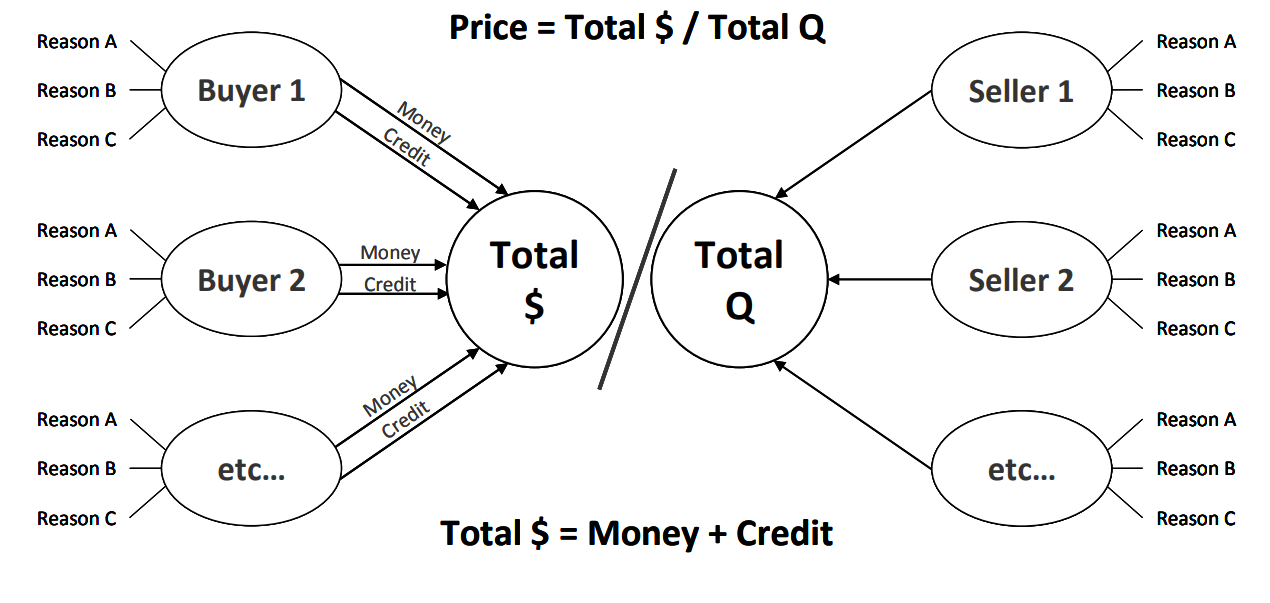
At its core, the economy is just the sum of all the transactions that make it up. A transaction is simple:
- A Buyer exchanges Money or Credit…
- …with a Seller…
- …for Goods, Services, or Financial Assets.
Think about buying groceries, getting a haircut, or buying stocks – these are all transactions.
A Market consists of all the buyers and sellers making transactions for the same thing (e.g., the wheat market, the car market). The Economy is simply all the transactions in all the markets.
The Price of anything is determined by the total amount spent divided by the total quantity sold:
Price = Total Spending ($) / Total Quantity Sold (Q)
The Most Important Ingredient: Credit
Spending can be done with Money (like cash) or Credit (like using a credit card or taking out a loan).
- Money settles a transaction instantly.
- Credit is a promise to pay money later. When you use credit, you create both an asset for the lender and a liability (debt) for yourself.
Credit is crucial because it’s the biggest and most volatile part of spending. There’s far more credit in the economy than actual money. For example, in the US, there might be around 3 trillion in actual money (currency and reserves).
Credit allows us to spend more than we earn today by borrowing from our future selves. This is what creates cycles.
Spending: The Engine of the Economy
Total Spending drives the economy. And total spending is simply:
Total Spending ($) = Money Spent + Credit Spent
If you know the total spending and the total quantity sold in any market (or the whole economy), you know almost everything you need to understand it.
The main buyers and sellers (spenders) fall into a few categories:
- Private Sector: Households and Businesses.
- Government Sector:
- Central Government: Spends money (raised via taxes or borrowing) on goods and services (like roads, schools, defense).
- Central Bank: Controls the amount of money and credit in the economy (e.g., the Federal Reserve in the US). It does this by influencing interest rates and printing money to buy financial assets (it doesn’t print money to buy goods/services directly).
The Three Big Forces Driving the Machine
Dalio argues that three main forces shape economic outcomes:
[
-
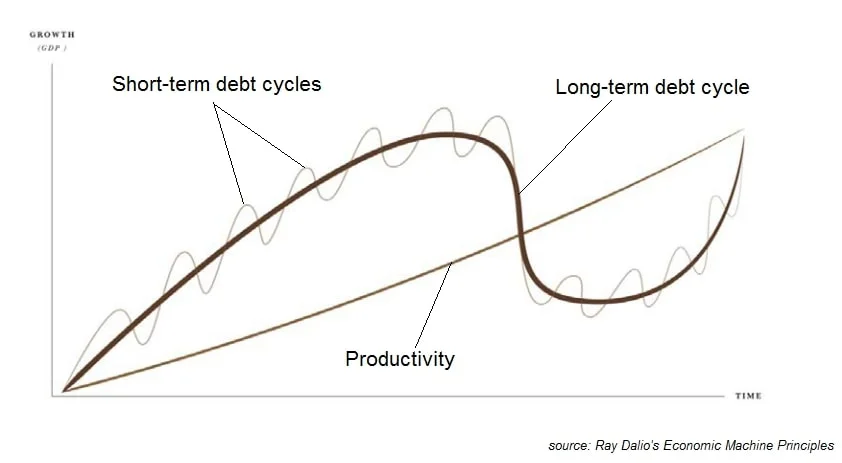
Productivity Growth: Over the long run, knowledge increases, leading to innovation and increased efficiency. This raises living standards. This is the most important factor over long periods. It trends upward relatively smoothly.
-
The Short-Term Debt Cycle (or Business Cycle): This cycle typically lasts 5-8 years. It’s primarily controlled by the Central Bank.
- Expansion: Spending increases (often fueled by credit), the economy grows, unemployment falls, and eventually, inflation starts to rise.
- Peak: Inflation becomes a concern, so the Central Bank tightens policy by raising interest rates to cool things down.
- Contraction (Recession): Higher interest rates make borrowing more expensive, spending slows, economic activity contracts, and unemployment rises.
- Trough: With the economy weak and inflation falling, the Central Bank eases policy by lowering interest rates.
- Expansion starts again: Lower rates encourage borrowing and spending, starting the cycle anew.
-
The Long-Term Debt Cycle: This cycle plays out over much longer periods, typically 50-75 years or more. It happens because, over many short-term cycles, debt tends to rise faster than income.
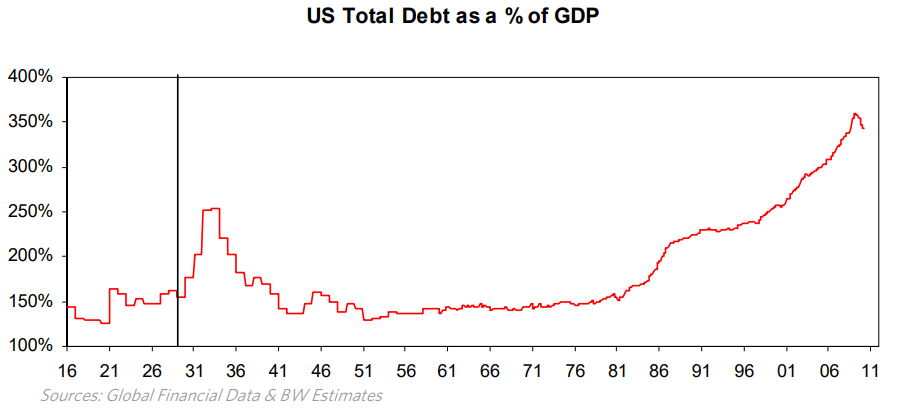
Understanding the Long-Term Debt Cycle & Deleveraging
During the upswing of the long-term debt cycle, debts grow, but rising incomes and asset values make servicing those debts manageable. People feel wealthy and borrow more; lenders freely lend. This happens over decades.
Eventually, however, debt burdens become too large. Debt service payments (principal + interest) start consuming too much income.
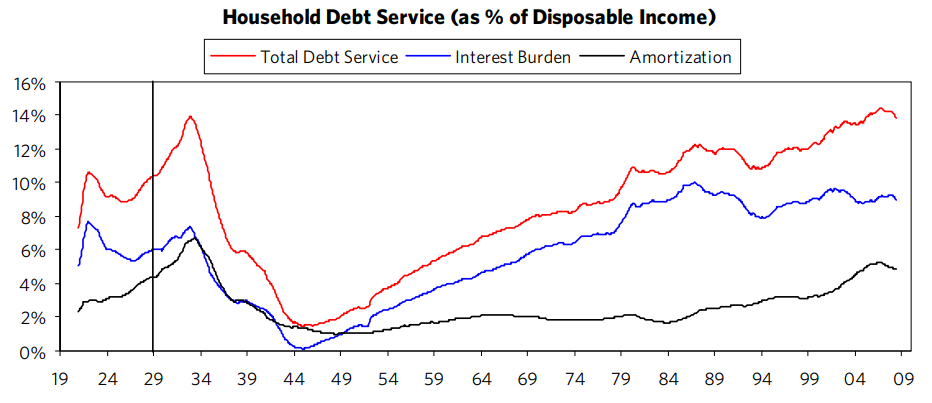
This leads to the peak of the long-term debt cycle. At this point, the Central Bank typically can’t lower interest rates anymore because they are already at or near 0%.
This situation triggers a Deleveraging. This is different and more severe than a normal recession because the main tool to stimulate the economy (lowering interest rates) is no longer effective at creating credit growth. People and businesses focus on paying down debt rather than spending.
How do debt burdens come down relative to income? Dalio identifies four ways:
- Debt Reduction: People, businesses, and governments default or restructure debts (debts are written down). (Deflationary)
- Austerity: People, businesses, and governments cut spending drastically. (Deflationary)
- Wealth Transfer: Wealth is redistributed, often through taxes from the “haves” to the “have-nots” or government support programs. (Can cause social tension)
- Debt Monetization: The Central Bank “prints” money and uses it to buy financial assets (including government bonds). This pushes money into the economy when credit isn’t flowing. (Inflationary)
The initial phase of a deleveraging is often a painful Depression, dominated by debt defaults and austerity. A “beautiful deleveraging,” according to Dalio, involves balancing these four levers carefully to reduce debt burdens without causing either a deflationary spiral or hyperinflation and social chaos. This process often takes about a decade (sometimes called a “lost decade”) for the economy to return to its prior peak level.
Putting It All Together: How the Forces Interact
Think of the economy’s path like this:
- The Productivity Growth line is the steady upward trend over centuries.
- The Long-Term Debt Cycle is a large wave oscillating around the productivity line over many decades.
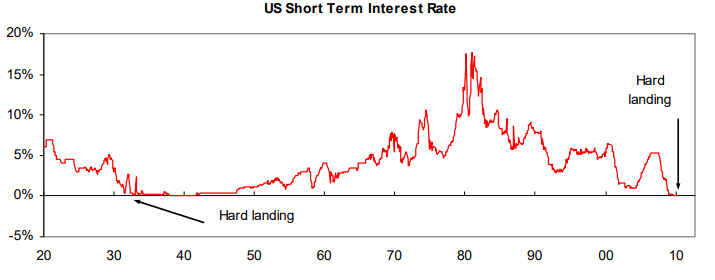
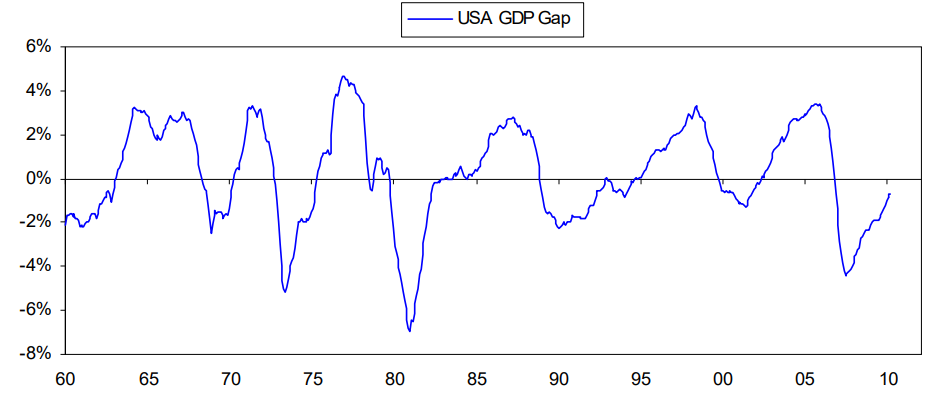
(The chart above shows the history of US short-term interest rates, illustrating the short-term cycles moving within the broader long-term trend of rising rates until ~1981 and falling rates afterwards until hitting 0%.)
By understanding which phase of each cycle we are in, we can better understand current economic events and potential future paths. Are debt burdens high or low? Is the Central Bank tightening or easing? Is inflation rising or falling? Are we in a normal recession or potentially a deleveraging?
Conclusion: Using the Template
Ray Dalio’s framework provides a powerful mental model for understanding the economic machine. It boils down to:
- The economy is the sum of Transactions.
- Credit is the most important part of spending and creates Cycles.
- Three main forces drive outcomes: Productivity Growth, the Short-Term Debt Cycle, and the Long-Term Debt Cycle.
- Deleveragings happen when long-term debt burdens become unsustainable and interest rates hit zero, requiring a different mix of policy responses.
Dalio offers three simple rules of thumb:
- Don’t have debt rise faster than income.
- Don’t have income rise faster than productivity.
- Do all you can to raise your productivity.
While no model can predict the future perfectly, this template offers a valuable way to understand the forces at play and make more sense of the economic world around us.
Source: Based on “How the Economic Machine Works” by Ray Dalio, © 2012 Bridgewater Associates, LP.